
การทดสอบสมมติฐาน
การทดสอบสมมติฐาน
สมมติฐาน คือคำตอบของปัญหาวิจัยที่ผู้วิจัยตั้งขึ้นไว้ล่วงหน้า หรืออาจเป็นความเชื่อหรือสิ่งที่ผู้วิจัยคาดไว้ ซึ่งอาจจะเป็นคำตอบที่ถูกหรือผิดก็ได้ จึงจำเป็นที่จะต้องมีการทดสอบ เพื่อหาข้อสรุปที่แน่นอนของปัญหาวิจัยนั้น
สำหรับ สมมติฐานทางสถิติ ก็คือข้อความที่กำหนดขึ้นมากับค่าพารามิเตอร์ของประชากรกลุ่มหนึ่งหรือหลายกลุ่ม ซึ่งอาจจะเป็นจริงหรือไม่เป็นจริงก็ได้ แล้วทำการทดสอบตามวิธีการทางสถิติเพื่อหาคำตอบ
การเขียนสมมติฐานสามารถเขียนได้ 2 ลักษณะ คือเขียนในรูปของ ข้อความ และในรูปของสัญลักษณ์ทางสถิติ เช่น รายได้เฉลี่ยของอาชีพวิศวกรของเพศชายไม่เท่ากับเพศหญิง ซึ่งอาจเขียนรูปแบบหนึ่ง คือ μ_1 ≠ μ_2 เป็นต้น
1. สมมติฐานทางสถิติ แบ่งออกเป็น 2 อย่าง ดังนี้
1.1 สมมติฐานหลัก แทนด้วย H_0 คือ สมมติฐานที่ต้องการให้ทดสอบ ซึ่งจะเป็นข้อความเกี่ยวกับพารามิเตอร์ที่อ้างถึงนั้นเป็นจริง
1.2 สมมติฐานรองหรือสมมติฐานเลือก แทนด้วย H_1 คือ สมมติฐานที่ตั้งให้แตกต่างจากสมมติฐานหลัก ซึ่งจะเป็นข้อความที่เสนอทางเลือกให้กับคำกล่าวของสมมติฐานหลักที่ตั้งไว้ไม่เป็นจริง
2. รูปแบบของการตั้งสมมติฐานทางสถิติ มี 3 รูปแบบ ดังนี้ (ถ้าให้ θ คือ พารามิเตอร์ใดๆ)
แบบที่ 1 H_0 : θ_1 = θ_2
H_0 : θ_1 ≠ θ_2
แบบที่ 2 H_0 : θ_1 ≤ θ_2
H_0 : θ_1 = θ_2
แบบที่ 3 H_0 : θ_1 ≥ θ_2
H_0 : θ_1 < θ_2
3. ความหมายของการทดสอบสมมติฐานทางสถิติ (Testing a Statistic Hypothesis) มีอยู่ 2 ลักษณะ ดังนี้
3.1 การยอมรับสมมติฐาน
3.2 การปฏิเสธสมมติฐาน
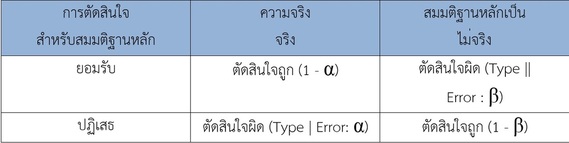
4. ความผิดพลาดในการตัดสินใจ เป็นความผิดพลาดที่เกิดขึ้นจากการตัดสินใจยอมรับหรือปฏิเสธสมมติฐานที่ผิด มี 2 ประเภท ดังนี้
4.1 ความผิดพลาดประเภทที่ 1 โอกาสที่จะเกิดความผิดพลาดประเภท 1 หรือความน่าจะเป็นที่จะปฏิเสธสมมติฐานหลักจริง
เรียกว่า ระดับความมีนัยสำคัญ ของการทดสอบ โดยปกติมักกำหนด ∝ = 0.01, 0.05 หรือ 0.10 โดยที่ ∝ = 0.10 หมายความว่า ในการทดลอง 100 ครั้ง จะมี 10 ครั้ง ที่เกิดความผิดพลาดประเภทที่ 1 ขึ้น
4.2 ความผิดพลาดประเภทที่ 2 โอกาสที่จะเกิดความผิดพลาดประเภท 1 หรือความน่าจะเป็นที่จะปฏิเสธสมมติฐานหลักโดยที่
สมมติฐานหลักไม่เป็นจริง
สมมติฐาน คือคำตอบของปัญหาวิจัยที่ผู้วิจัยตั้งขึ้นไว้ล่วงหน้า หรืออาจเป็นความเชื่อหรือสิ่งที่ผู้วิจัยคาดไว้ ซึ่งอาจจะเป็นคำตอบที่ถูกหรือผิดก็ได้ จึงจำเป็นที่จะต้องมีการทดสอบ เพื่อหาข้อสรุปที่แน่นอนของปัญหาวิจัยนั้น
สำหรับ สมมติฐานทางสถิติ ก็คือข้อความที่กำหนดขึ้นมากับค่าพารามิเตอร์ของประชากรกลุ่มหนึ่งหรือหลายกลุ่ม ซึ่งอาจจะเป็นจริงหรือไม่เป็นจริงก็ได้ แล้วทำการทดสอบตามวิธีการทางสถิติเพื่อหาคำตอบ
การเขียนสมมติฐานสามารถเขียนได้ 2 ลักษณะ คือเขียนในรูปของ ข้อความ และในรูปของสัญลักษณ์ทางสถิติ เช่น รายได้เฉลี่ยของอาชีพวิศวกรของเพศชายไม่เท่ากับเพศหญิง ซึ่งอาจเขียนรูปแบบหนึ่ง คือ μ_1 ≠ μ_2 เป็นต้น
1. สมมติฐานทางสถิติ แบ่งออกเป็น 2 อย่าง ดังนี้
1.1 สมมติฐานหลัก แทนด้วย H_0 คือ สมมติฐานที่ต้องการให้ทดสอบ ซึ่งจะเป็นข้อความเกี่ยวกับพารามิเตอร์ที่อ้างถึงนั้นเป็นจริง
1.2 สมมติฐานรองหรือสมมติฐานเลือก แทนด้วย H_1 คือ สมมติฐานที่ตั้งให้แตกต่างจากสมมติฐานหลัก ซึ่งจะเป็นข้อความที่เสนอทางเลือกให้กับคำกล่าวของสมมติฐานหลักที่ตั้งไว้ไม่เป็นจริง
2. รูปแบบของการตั้งสมมติฐานทางสถิติ มี 3 รูปแบบ ดังนี้ (ถ้าให้ θ คือ พารามิเตอร์ใดๆ)
แบบที่ 1 H_0 : θ_1 = θ_2
H_0 : θ_1 ≠ θ_2
แบบที่ 2 H_0 : θ_1 ≤ θ_2
H_0 : θ_1 = θ_2
แบบที่ 3 H_0 : θ_1 ≥ θ_2
H_0 : θ_1 < θ_2
3. ความหมายของการทดสอบสมมติฐานทางสถิติ (Testing a Statistic Hypothesis) มีอยู่ 2 ลักษณะ ดังนี้
3.1 การยอมรับสมมติฐาน
3.2 การปฏิเสธสมมติฐาน
4. ความผิดพลาดในการตัดสินใจ เป็นความผิดพลาดที่เกิดขึ้นจากการตัดสินใจยอมรับหรือปฏิเสธสมมติฐานที่ผิด มี 2 ประเภท ดังนี้
4.1 ความผิดพลาดประเภทที่ 1 โอกาสที่จะเกิดความผิดพลาดประเภท 1 หรือความน่าจะเป็นที่จะปฏิเสธสมมติฐานหลักจริง
เรียกว่า ระดับความมีนัยสำคัญ ของการทดสอบ โดยปกติมักกำหนด ∝ = 0.01, 0.05 หรือ 0.10 โดยที่ ∝ = 0.10 หมายความว่า ในการทดลอง 100 ครั้ง จะมี 10 ครั้ง ที่เกิดความผิดพลาดประเภทที่ 1 ขึ้น
4.2 ความผิดพลาดประเภทที่ 2 โอกาสที่จะเกิดความผิดพลาดประเภท 1 หรือความน่าจะเป็นที่จะปฏิเสธสมมติฐานหลักโดยที่
สมมติฐานหลักไม่เป็นจริง
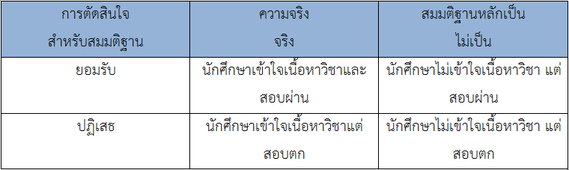
ตัวอย่าง ในการสอบวิชาคอมพิวเตอร์ อาจารย์จะต้องตัดสินใจให้นักศึกษาผ่านหรือไม่ผ่านในวิชานี้
H_0 : นักศึกษาเข้าใจเนื้อหาเกี่ยวกับวิชาคอมพิวเตอร์
H_1 : นักศึกษาไม่เข้าใจเนื้อหาเกี่ยวกับวิชาคอมพิวเตอร์
H_0 : นักศึกษาเข้าใจเนื้อหาเกี่ยวกับวิชาคอมพิวเตอร์
H_1 : นักศึกษาไม่เข้าใจเนื้อหาเกี่ยวกับวิชาคอมพิวเตอร์
ในการทดสอบสมมติฐานมักจะพบว่ามีความผิดพลาดทั้ง 2 ประเภท (∝ -β) เกิดขึ้น ซึ้งผู้วิจัยต้องการให้เกิดขึ้นน้อยที่สุด แต่การที่ลดค่า ∝ จะมีผลทำให้ค่า β เพิ่มขึ้น ในทำนองเดียวกัน ถ้าลด β จะทำให้ ∝ เพิ่มขึ้น เนื่องจากการตัดสินใจที่ผิดพลาดแบบ β มีความรุนแรงน้อยกว่า ∝ ผู้วิจัยส่วนใหญ่จึงกำหนดค่า ∝ ที่ยอมรับ แต่อย่างไรก็ตามถ้าขนาดตัวอย่างเพิ่มมากขึ้นจะทำให้ความผิดพลาดประเภททั้ง 2 ประเภทลดลง
5. ประเภทของการทดสอบสมมติฐานทางสถิติ มีอยู่ 2 ลักษณะ ดังนี้
5.1 การทดสอบแบบสองทาง
แบบที่ 1 H0 : θ_1= θ_2
H0 : θ_1≠ θ_2
5.2 การทดสอบแบบทางเดียว
แบบที่ 2 H_0 : θ_1≤ θ_2
H_1 : θ_1= θ_2
5.3 แบบที่ 3 H_0 : θ_1≥ θ_2
H_1 : θ_1< θ_2
6.ขั้นตอนการทดสอบสมมติฐาน โดยทั่วไปมีขั้นตอน ดังนี้
6.1 ตั้งสมมติฐาน H_0 และ H_1 เพื่อใช้ในการทดสอบ
6.2 กำหนดระดับนัยสำคัญ เช่น ∝ = 0.01, ∝ = 0.05
6.3 เลือกสถิติทดสอบที่เหมาะสม โดยคำนึงถึงข้อตกลงเบื้องต้นของสถิติทดสอบที่เลือกนั้นและคำนวณค่าสถิติทดสอบ
6.4 หาจุดวิกฤต และบริเวณวิกฤต ซึ่งเป็นค่าที่แบ่งเขตการยอมรับหรือปฏิเสธสมมติฐานหลัก
6.5 สรุปผลการทดสอบ
โดยสรุป ความแตกต่างระหว่างการประมาณค่าและการทดสอบสมมติฐาน คือการประมาณค่านั้น
ผู้วิจัยไม่มีแนวคิดมาก่อนว่า ค่าพารามิเตอร์ของประชากรที่ผู้วิจัยประมาณนั้นจะมีค่าเป็นเท่าไรการประมาณค่า
The test hypothesis
The test hypothesis
The research hypothesis is the answer of the problem the research set up in advance or may be a belief that the research or what is expected to be in the answer which may be wrong or that it is necessary to have a test to reach a conclusion on the issue, of course, research and statistics for hypothesis, it is the message that set up the parameters of the population group of one or more groups which may be true or not true, and then run the tests in accordance with any statistical methods to find answers.
The assumption can be written. Write 2 characteristics is written in the form of the message, and in the form of statistics, such as the symbol of the average income of professional engineers are not equal to Male Female which may be one of the Forms is writtenµ µ_ _ 1 = ̸ 2, etc.
1. Statistical hypothesis is divided into 2, as follows.
1.1 Instead of a main hypothesis H _0 is the assumption that you want to test the parameters which will be referred to as a message about it. This is true.
1.2 Select the secondary or hypothesis hypothesis H _ 1 is replaced by the assumption that the main assumption that will be different from the message offered a choice, with the words of the main hypothesis is not true.
2. The assumption of the statistical models are as follows: 3 (if it is, θ any parameters).
Type 1 H_0: θ_1 = θ_2.
H_0: θ_1 ≠ θ_2
Type 2 H_0: θ_1 ≤ θ_2.
H_0: θ_1 = θ_2
Type 3 H_0: θ_1 ≥ θ_2.
H_0: θ_1 <θ_2
3. The meaning of statistical hypothesis tests (a Testing Statistic Hypothesis) is as follows: 2.
3.1 The accepted hypothesis
3.2 The hypothesis rejected
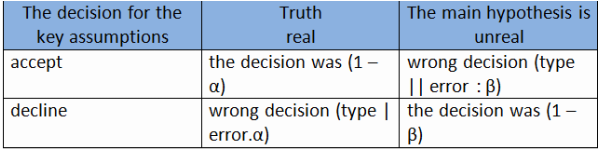
4. The error in the decision is a mistake caused by the decision to accept or reject the wrong assumption there are 2 types, as follows.
4.1 The type of error that 1 chance that there will be 1 types of errors or the main hypothesis is likely to be rejected , the actual significance of the test usually define ∝ = 0.01, 0.05 Ajarn ∝ = 0.10, which means that in the experiment 100 times. There will be 10 times the error type 1.
4.2 The type of error that 2 chance of type 1 error is likely to be rejected or the main hypothesis, the hypothesis is not true.
The research hypothesis is the answer of the problem the research set up in advance or may be a belief that the research or what is expected to be in the answer which may be wrong or that it is necessary to have a test to reach a conclusion on the issue, of course, research and statistics for hypothesis, it is the message that set up the parameters of the population group of one or more groups which may be true or not true, and then run the tests in accordance with any statistical methods to find answers.
The assumption can be written. Write 2 characteristics is written in the form of the message, and in the form of statistics, such as the symbol of the average income of professional engineers are not equal to Male Female which may be one of the Forms is writtenµ µ_ _ 1 = ̸ 2, etc.
1. Statistical hypothesis is divided into 2, as follows.
1.1 Instead of a main hypothesis H _0 is the assumption that you want to test the parameters which will be referred to as a message about it. This is true.
1.2 Select the secondary or hypothesis hypothesis H _ 1 is replaced by the assumption that the main assumption that will be different from the message offered a choice, with the words of the main hypothesis is not true.
2. The assumption of the statistical models are as follows: 3 (if it is, θ any parameters).
Type 1 H_0: θ_1 = θ_2.
H_0: θ_1 ≠ θ_2
Type 2 H_0: θ_1 ≤ θ_2.
H_0: θ_1 = θ_2
Type 3 H_0: θ_1 ≥ θ_2.
H_0: θ_1 <θ_2
3. The meaning of statistical hypothesis tests (a Testing Statistic Hypothesis) is as follows: 2.
3.1 The accepted hypothesis
3.2 The hypothesis rejected
4. The error in the decision is a mistake caused by the decision to accept or reject the wrong assumption there are 2 types, as follows.
4.1 The type of error that 1 chance that there will be 1 types of errors or the main hypothesis is likely to be rejected , the actual significance of the test usually define ∝ = 0.01, 0.05 Ajarn ∝ = 0.10, which means that in the experiment 100 times. There will be 10 times the error type 1.
4.2 The type of error that 2 chance of type 1 error is likely to be rejected or the main hypothesis, the hypothesis is not true.
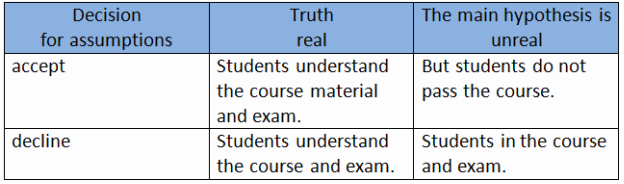
an example in the test computer science teachers will need to decide whether to give students through this subject through the
H _ 0: students understand the content of computer science
H _ 1: students do not understand the content of computer science
H _ 0: students understand the content of computer science
H _ 1: students do not understand the content of computer science
In the test hypothesis is often found that there is an error in 2 categories (∝ - β) perspective, the research needs to happen, but at least most of the lower cost ∝ will result in increased value β β will be reduced by the same if you make ∝ increase because the decision is a mistake. β ∝ violence less than the most research has been set up at ∝ accepted, however, if a sample will be increased to 2 types of both types of errors.
5. What type of test is a statistical hypothesis 2.
5.1 Two tailed Test
Type 1 H0: θ_1 = θ_2.
H0: θ_1 ≠ θ_2
5.2 One-tailed Test
Type 2 H_0: θ_1≤ θ_2.
H_1: θ_1 = θ_2
5.3 Type 3 H_0: θ_1≥ θ_2.
H_1: θ_1 <θ_2
6. The test process steps are as follows: general assumptions.
6.1 H_0 and H_1 assumptions used in the test.
6.2 The level of significance, such as α = 0.01, α = 0.05.
6.3 Select the appropriate test With regard to the agreement of the selected sample and calculate the statistics.
6.4 Find the critical points and the critical region. Which is a division of accepting or rejecting the null hypothesis.
6.5 Summary of test results
In summary of the difference between the estimated values and the test hypothesis is about the value that the research does not have the idea that the parameters of the population about the research that is so much about the value
