
การวิเคราะห์ความแปรปรวนทางเดียว
1. หลักการของการวิเคราะห์ความแปรปรวนทางเดียว ดังนี้
ความแปรปรวนทั้งหลาย = ความแปรผันระหว่างกลุ่มประชากร + ความแปรผันภายในกลุ่มประชากร
การวิเคราะห์ความแปรปรวนทางเดียว หรือที่นิยมเรียกว่า One Way ANOVA ใช้ในกรณีที่มีการจำแนกข้อมูลตามปัจจัยที่สนใจศึกษาเพียงปัจจัยเดียวเท่านั้น แต่มีหลายสิ่งทดลอง เช่น
1.1 ต้องการทดสอบความแตกต่างของวิธีการเลี้ยงดูเด็กช่วงอายุ 1-2 ปี 5 วิธี
1.2 ต้องการทดสอบความแตกต่างของผลผลิตทุเรียน 4 พันธุ์
1.3 ต้องการทดสอบความแตกต่างของอายุการใช้งานหลอดไฟ 4 ยี่ห้อ เป็นต้น
จากตัวอย่าง จะเห็นว่าวิธีเลี้ยงดูเด็ก พันธุ์ทุเรียนและยี่ห้อของหลอดไฟ คือปัจจัยที่สนใจศึกษา ซึ่งผู้วิจัยสามารถกล่าวได้ว่า แต่ละกลุ่มของปัจจัยที่สนใจศึกษานั้น เป็นประชากรแต่ละประชากรและผู้วิจัยต้องการทดสอบว่าประชากรเหล่านั้น (ซึ่งมีผลมาจากปัจจัยต่างกันนั้น) มีค่าเฉลี่ยแตกต่างกันหรือไม่
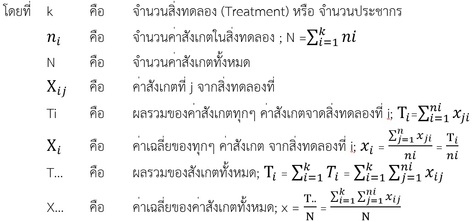
ตัวอย่างสุ่มขนาด n ถูกเลือกมาจาก k ประชากร (ประชากรละ n_1 โดยที่ i=1, 2,…k) โดยที่ k
ประชากรนี้เป็นอิสระจากกัน และตัวอย่างแต่ละกลุ่ม มีการแจกแจงปกติ มีค่าเฉลี่ยเป็น μ_1 = μ_2 = μ_3… = μ_k และความแปรปรวนเป็น σ^2
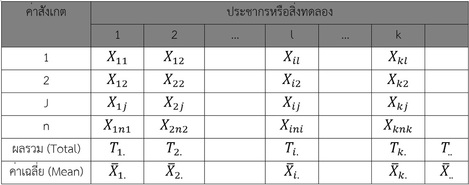
2. ตารางแสดงข้อมูลที่จัดแบบจำแนกทางเดียว
ความแปรปรวนทั้งหลาย = ความแปรผันระหว่างกลุ่มประชากร + ความแปรผันภายในกลุ่มประชากร
การวิเคราะห์ความแปรปรวนทางเดียว หรือที่นิยมเรียกว่า One Way ANOVA ใช้ในกรณีที่มีการจำแนกข้อมูลตามปัจจัยที่สนใจศึกษาเพียงปัจจัยเดียวเท่านั้น แต่มีหลายสิ่งทดลอง เช่น
1.1 ต้องการทดสอบความแตกต่างของวิธีการเลี้ยงดูเด็กช่วงอายุ 1-2 ปี 5 วิธี
1.2 ต้องการทดสอบความแตกต่างของผลผลิตทุเรียน 4 พันธุ์
1.3 ต้องการทดสอบความแตกต่างของอายุการใช้งานหลอดไฟ 4 ยี่ห้อ เป็นต้น
จากตัวอย่าง จะเห็นว่าวิธีเลี้ยงดูเด็ก พันธุ์ทุเรียนและยี่ห้อของหลอดไฟ คือปัจจัยที่สนใจศึกษา ซึ่งผู้วิจัยสามารถกล่าวได้ว่า แต่ละกลุ่มของปัจจัยที่สนใจศึกษานั้น เป็นประชากรแต่ละประชากรและผู้วิจัยต้องการทดสอบว่าประชากรเหล่านั้น (ซึ่งมีผลมาจากปัจจัยต่างกันนั้น) มีค่าเฉลี่ยแตกต่างกันหรือไม่
ตัวอย่างสุ่มขนาด n ถูกเลือกมาจาก k ประชากร (ประชากรละ n_1 โดยที่ i=1, 2,…k) โดยที่ k
ประชากรนี้เป็นอิสระจากกัน และตัวอย่างแต่ละกลุ่ม มีการแจกแจงปกติ มีค่าเฉลี่ยเป็น μ_1 = μ_2 = μ_3… = μ_k และความแปรปรวนเป็น σ^2
2. ตารางแสดงข้อมูลที่จัดแบบจำแนกทางเดียว
3. การทดสอบสมมติฐานและการสรุปผล
โดยทั่วไปมีขั้นตอนการทดสอบ ดังนี้
3.1. กำหนดสมมติฐานที่ใช้ในการทดสอบ
H_(0 ∶ ) μ_1 = μ_2 = μ_3… = μ_k
H_(1 ∶ )มีค่าเฉลี่ยของประชากรอย่างน้อยหนึ่งกลุ่มที่มีค่าไม่เท่ากับค่าเฉลี่ยชองประชากรกลุ่มอื่น
3.2. กำหนดระดับนัยสำคัญ (α)
3.3. สถิติที่ใช้ในการทดสอบ คือ F-Test และสร้างตาราง ANOVA (ได้ค่า F_คำนวณ)
3.4. หาจุดวิกฤตและบริเวณวิกฤต โดยการเปิดตาราง F (ได้ค่า F_คำนวณ)
3.5. สรุปผลการทดสอบ
* ถ้า F_คำนวณ < F_คำนวณ จะ Accept H_0 นั่นคือ μ_1 = μ_2 = μ_3… = μ_k
* ถ้า F_คำนวณ ≥< F_ตาราง จะ Reject H_0 นั่นคือ มีค่าเฉลี่ยของประชากรอย่างน้อยหนึ่งกลุ่มที่ต่างจากประชากรกลุ่มอื่น
The analysis of uncertainty in one way
1. The analysis of uncertainty in one way.The epic, = the variation between Population variation within the group of population +
Variances are = Variance were varied among populations + the variation within a population.
The analysis of uncertainty in one way or the popular called One Way ANOVA used in the case of a classified information in accordance with the factors study only one factor only, but there are several things such as trial
1.1 You want to test the difference of how to feed children between the ages 1-2, 5 way.
1.2 You want to test the difference of productivity 4 durian species.
1.3 To test the difference of 4 Lamp life brand, etc.
In the example you can see that the children take care of plants of which there are many varieties and brands of lamps is a factor that the research study can be said that each group of factors that are interested in the study population and the population each research population that want to test them (which is the result of many factors, average different?
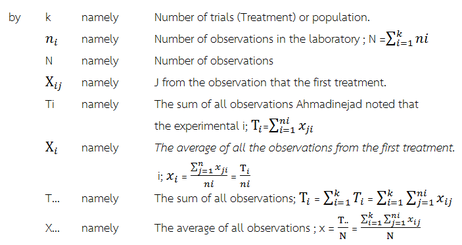
A random sample of size n k is selected from the population (population per n_1, where i = 1, 2, ... k), where k.
This demographic is independent And each sample The normal distribution With mean μ_1 = μ_2 = μ_3 ... = μ_k and the variance is σ ^ 2.
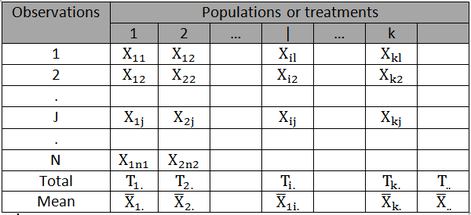
2. He table lists the information available, identify the one.
Variances are = Variance were varied among populations + the variation within a population.
The analysis of uncertainty in one way or the popular called One Way ANOVA used in the case of a classified information in accordance with the factors study only one factor only, but there are several things such as trial
1.1 You want to test the difference of how to feed children between the ages 1-2, 5 way.
1.2 You want to test the difference of productivity 4 durian species.
1.3 To test the difference of 4 Lamp life brand, etc.
In the example you can see that the children take care of plants of which there are many varieties and brands of lamps is a factor that the research study can be said that each group of factors that are interested in the study population and the population each research population that want to test them (which is the result of many factors, average different?
A random sample of size n k is selected from the population (population per n_1, where i = 1, 2, ... k), where k.
This demographic is independent And each sample The normal distribution With mean μ_1 = μ_2 = μ_3 ... = μ_k and the variance is σ ^ 2.
2. He table lists the information available, identify the one.
3. To test their hypothesis and the conclusion.
In general the test process are as follows.
3.1. The assumptions used in the test.
H_ (0:) μ_1 = μ_2 = μ_3 ... = μ_k.
H_ (1:) is the average of the population, at least one group that is not equal to the average channel population groups.
3.2. Level significantly (α).
3.3. The statistics used to test the F-Test and create a table ANOVA (F_ value calculation).
3.4. Find the critical points and the critical region. The Open Table F (F_ value calculation).
3.5. Summary of test results
* If the calculated F_ <F_ calculated to Accept H_0 is μ_1 = μ_2 = μ_3 ... = μ_k.
* If F_ calculated ≥ <F_ Reject H_0 table is an average of the population that is at least one group that is different from other populations.
