
การวัดการกระจายของข้อมูล
การวัดการกระจายของข้อมูล
"การวัดการกระจายของข้อมูล" หมายถึงการคำนวณว่าข้อมูลชุดใดชุดหนึ่งกระจายออกจากกัน หรืออยู่ห่างกันมากน้อยเพียงใด ถ้าคะแนนของข้อมูลในชุดใดอยู่ห่างกันน้อยหรือมีขนาดใกล้เคียงกัน เรียกว่าข้อมูลชุดนั้นมีการกระจายน้อย แต่ถ้าคะแนนของข้อมูลในชุดใดอยู่ห่างกันมาก เรียกว่าข้อมูลชุดนั้นมีการกระจายมาก
การอธิบายลักษณะของข้อมูลโดยวิธีการวัดแนวโน้มเข้าสู่ส่วนกลางเป็นการอธิบายลักษณะของข้อมูลเพียงลักษณะเดียว ส่วนลักษณะอื่นๆไม่สามารถแสดงได้ด้วยการวัดแนวโน้มเข้าสู่ส่วนกลาง ตัวอย่าง เช่น
ข้อมูลชุดที่ 1 : 5 11 18 25 41
ข้อมูลชุดที่ 2 : 14 20 21 22 23
มัชฌิมเลขคณิตของข้อมูลชุดที่ 1 = (5 + 11 + 18 + 25 + 41) / 5
= 100 / 5
= 20
มัชฌิมเลขคณิตของข้อมูลชุดที่ 2 = (14 + 20 + 21 + 22 + 23) / 5
= 100 / 5
= 20
จะเห็นว่าค่ามัชฌิมเลขคณิตของข้อมูลทั้งสองชุดมีค่าเท่ากัน โดยที่ลักษณะของข้อมูลทั้งสองชุดต่างกัน ข้อมูลชุดที่ 1 ประกอบด้วยคะแนนที่มีค่าสูงสุดและต่ำสุดแตกต่างกันมาก ส่วนข้อมูลชุดที่ 2 ประกอบด้วยคะแนนที่มีค่าใกล้เคียงกัน ซึ่งการใช้มัชฌิมเลขคณิตเป็นตัวแทนของข้อมูลทั้งสองชุด ทำให้ผู้ที่ไม่ทราบข้อมูลทั้งสองชุดมีความเข้าใจผิดว่าข้อมูลทั้งสองชุดนั้นมีลักษณะเหมือนกัน ดังนั้นจึงจำเป็นต้องมีการวัดการกระจายของข้อมูลด้วย เพื่อทำให้ทราบลักษณะของข้อมูลชัดเจนยิ่งขึ้น
สถิติสำหรับการคำนวณหาค่าการกระจายมีอยู่หลายวิธีดังนี้
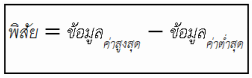
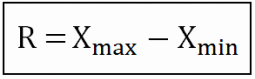
1. พิสัย คือการหาค่าสูงสุดของข้อมูลลบค่าต่ำสุดของข้อมูล
"การวัดการกระจายของข้อมูล" หมายถึงการคำนวณว่าข้อมูลชุดใดชุดหนึ่งกระจายออกจากกัน หรืออยู่ห่างกันมากน้อยเพียงใด ถ้าคะแนนของข้อมูลในชุดใดอยู่ห่างกันน้อยหรือมีขนาดใกล้เคียงกัน เรียกว่าข้อมูลชุดนั้นมีการกระจายน้อย แต่ถ้าคะแนนของข้อมูลในชุดใดอยู่ห่างกันมาก เรียกว่าข้อมูลชุดนั้นมีการกระจายมาก
การอธิบายลักษณะของข้อมูลโดยวิธีการวัดแนวโน้มเข้าสู่ส่วนกลางเป็นการอธิบายลักษณะของข้อมูลเพียงลักษณะเดียว ส่วนลักษณะอื่นๆไม่สามารถแสดงได้ด้วยการวัดแนวโน้มเข้าสู่ส่วนกลาง ตัวอย่าง เช่น
ข้อมูลชุดที่ 1 : 5 11 18 25 41
ข้อมูลชุดที่ 2 : 14 20 21 22 23
มัชฌิมเลขคณิตของข้อมูลชุดที่ 1 = (5 + 11 + 18 + 25 + 41) / 5
= 100 / 5
= 20
มัชฌิมเลขคณิตของข้อมูลชุดที่ 2 = (14 + 20 + 21 + 22 + 23) / 5
= 100 / 5
= 20
จะเห็นว่าค่ามัชฌิมเลขคณิตของข้อมูลทั้งสองชุดมีค่าเท่ากัน โดยที่ลักษณะของข้อมูลทั้งสองชุดต่างกัน ข้อมูลชุดที่ 1 ประกอบด้วยคะแนนที่มีค่าสูงสุดและต่ำสุดแตกต่างกันมาก ส่วนข้อมูลชุดที่ 2 ประกอบด้วยคะแนนที่มีค่าใกล้เคียงกัน ซึ่งการใช้มัชฌิมเลขคณิตเป็นตัวแทนของข้อมูลทั้งสองชุด ทำให้ผู้ที่ไม่ทราบข้อมูลทั้งสองชุดมีความเข้าใจผิดว่าข้อมูลทั้งสองชุดนั้นมีลักษณะเหมือนกัน ดังนั้นจึงจำเป็นต้องมีการวัดการกระจายของข้อมูลด้วย เพื่อทำให้ทราบลักษณะของข้อมูลชัดเจนยิ่งขึ้น
สถิติสำหรับการคำนวณหาค่าการกระจายมีอยู่หลายวิธีดังนี้
1. พิสัย คือการหาค่าสูงสุดของข้อมูลลบค่าต่ำสุดของข้อมูล
2. พิสัยควอไทล์ คือค่าความแตกต่างระหว่างควอไทล์ที่ 3 กับ ควอไทล์ที่ 1 ( IQR = Q3-Q1 )
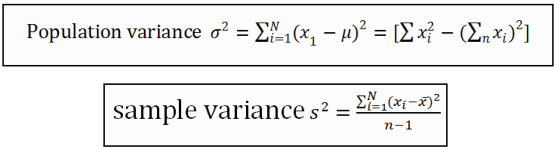
3. ความแปรปรวน เป็นค่าที่นิยมนำมาใช้วัดการกระจายของข้อมูลมากที่สุด ซึ่งค่านี้คำนวณมาจากค่าแตกต่างระหว่างค่าของข้อมูลแต่ละค่ากับค่าเฉลี่ย ซึ่งถ้าค่าที่ได้เป็นศูนย์ แสดงว่าข้อมูลชนิดนั้นไม่มีการกระจายเลยหรือทุกค่ามีค่าเท่ากับค่ากลางนั่นเอง
3. ความแปรปรวน เป็นค่าที่นิยมนำมาใช้วัดการกระจายของข้อมูลมากที่สุด ซึ่งค่านี้คำนวณมาจากค่าแตกต่างระหว่างค่าของข้อมูลแต่ละค่ากับค่าเฉลี่ย ซึ่งถ้าค่าที่ได้เป็นศูนย์ แสดงว่าข้อมูลชนิดนั้นไม่มีการกระจายเลยหรือทุกค่ามีค่าเท่ากับค่ากลางนั่นเอง
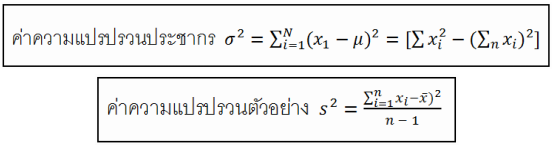
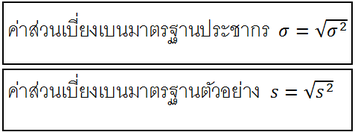
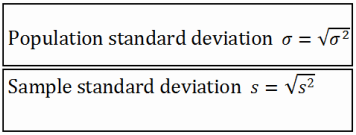
4. ค่าส่วนเบี่ยงเบนมาตรฐาน คือค่ารากที่ 2 ของความแปรปรวน
5. ค่าความคลาดเคลื่อนมาตรฐานของค่าเฉลี่ย คือ ค่าที่พิจารณามาจากค่าแตกต่างระหว่างค่าเฉลี่ยของตัวอย่างกับค่าเฉลี่ยของประชากร
ค่าความกระจายที่ไม่ว่าจะคำนวณด้วยวิธีใด ถ้าค่าที่ได้มีค่ามากแสดงว่าข้อมูลมีการกระจายมาก หากค่าที่ได้มีน้อย แสดงว่าข้อมูลมีการกระจายน้อย
ค่าความกระจายที่ไม่ว่าจะคำนวณด้วยวิธีใด ถ้าค่าที่ได้มีค่ามากแสดงว่าข้อมูลมีการกระจายมาก หากค่าที่ได้มีน้อย แสดงว่าข้อมูลมีการกระจายน้อย
Measure the distribution of the data.
Measure the distribution of data
"Measuring the distribution of the data" means the information that one of the calculated spread out from each other or are away from each other. How many points if any of the information in the unit is away from each other. Or at least a similar data set, called a little but if the distribution of data points in the SET which is called away from each other. More information, there is a distribution.
Explain the characteristics of the data, How to measure trends in the middle of a description of the data just like the other way is not likely to be displayed in the temple in the middle for example:
Data set 1: 5 11 18 25 41
Data sets 2:14 20 21 22 23
1 arithmetic middle age of the data. = (5 + 11 + 18 + 25 + 41) / 5
= 100/5
= 20
2 arithmetic middle age of the data. = (14 + 20 + 21 + 22 + 23) / 5
= 100/5
= 20
to see that the value of information in both the arithmetic middle age has equal value, by the nature of the information and the two different data sets that contain 1 points that have a maximum and minimum data sets and very different. The 2 points with a similar setting, the arithmetic middle age as the representative of both data sets, those who do not know the information both the wrong with the information that the two units are identical, so it is necessary to measure the distribution of the data in order to make you know the characteristics of information more clearly.
Statistics for calculating the distribution is available in several ways:
1. The range is the maximum value of the data to remove the minimum value of the data
2.Highlight the range, squash, is the difference between a squash court, highlight the 3 to highlight a squash court, a 1 (IQR=Q 3-Q 1)
3. The Epic is the most popular measure used to distribute most of the information that this is calculated from the difference between the average value of each data value, if the value is zero, the data is not available for distribution, or any value is equal to the value in itself.
3. The Epic is the most popular measure used to distribute most of the information that this is calculated from the difference between the average value of each data value, if the value is zero, the data is not available for distribution, or any value is equal to the value in itself.
4. The standard deviation is the square root of the adverse 2.
5. The standard deviation of the average value is determined from the difference between the average of a sample of the population average
The distribution will be calculated in a way that is not that any more. If the value of the information that is available for distribution. If the value is at least show that the information is distributed at least
The distribution will be calculated in a way that is not that any more. If the value of the information that is available for distribution. If the value is at least show that the information is distributed at least
